

Gold has witnessed a sharp rally over the last 6 years (2019-2025), gaining ~20% annually and nearly tripling!
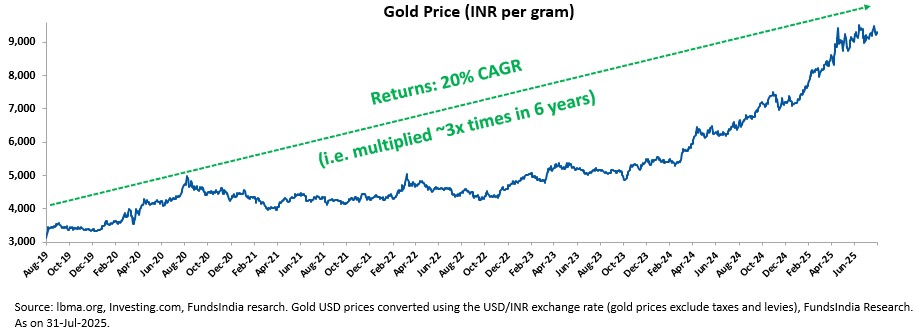
But here’s the catch!
Despite Gold’s recent stellar performance, history reminds us that gold is a cyclical asset. Periods of rapid gains were often followed by long, flat stretches.
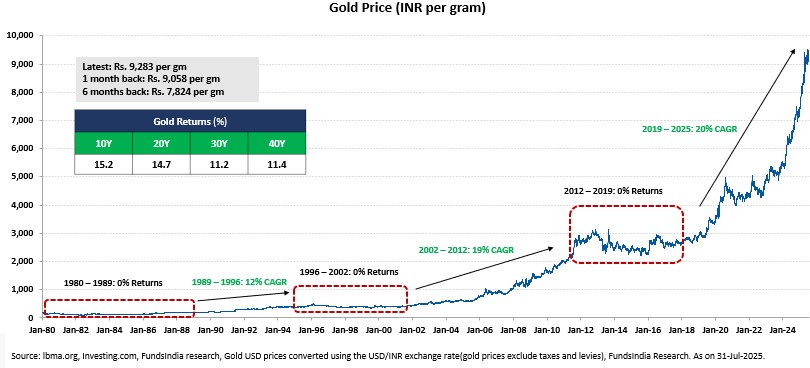
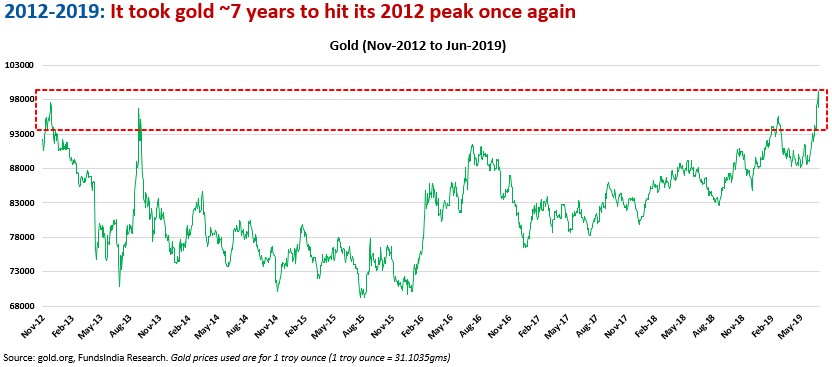
For eg- From 2012 to 2019, Gold prices barely moved, giving almost no returns.
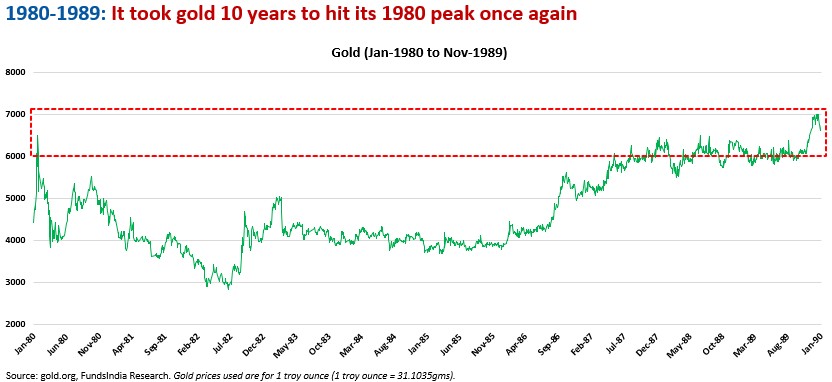
From 1980 to 1989, gold stayed flat for nearly a decade.
Oops!
Trying to guess what gold will do next based on recent performance is tempting. But it’s also unhelpful.
A more useful question is: Where are we in the cycle? And even more importantly: What should a sensible investor do about it?
The goal is not to get the timing perfect. It never is. The goal is to stay thoughtful, balanced, and anchored to first principles.
Let’s look at where gold stands today – not through opinions, but through evidence.
Introducing our Gold ‘C-Y-C-L-E’ Framework…
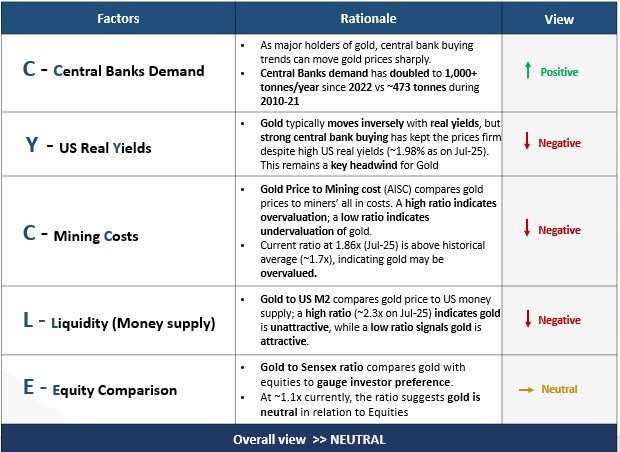
We break this down using 5 key factors to evaluate Gold at any point in time.
- C- Central Banks Demand
- Y- US Real Yields
- C – Mining Costs
- L – Liquidity (US M2 Money Supply)
- E – Equity Comparison
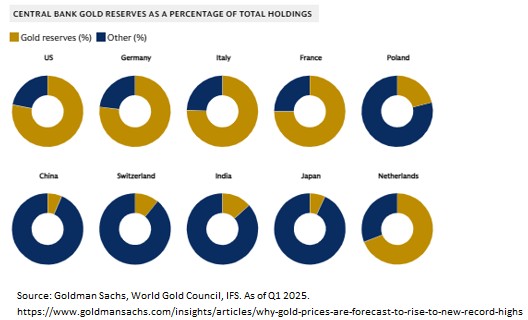
1. C- Central Banks Demand
Central banks hold a major chunk of the world’s gold, giving them a strong influence on gold prices. Even small changes in their buying or selling can move gold prices sharply.
Developed market central banks hold ~75-80% of their reserves in gold, while Emerging markets central banks hold just 5-10%.
But the tide is turning!
Emerging markets are now catching up and are increasing their gold reserves to diversify and reduce reliance on the US dollar.
For eg – From 2010-2021, Central banks bought ~473 tonnes of gold annually (~10-11% of global gold demand).
Since 2022, this annual demand has doubled to 1,000+ tonnes (~23% of global gold demand), led by freezing of Russia’s currency reserves by the Western nations -> a wake-up call for countries to shift towards gold.
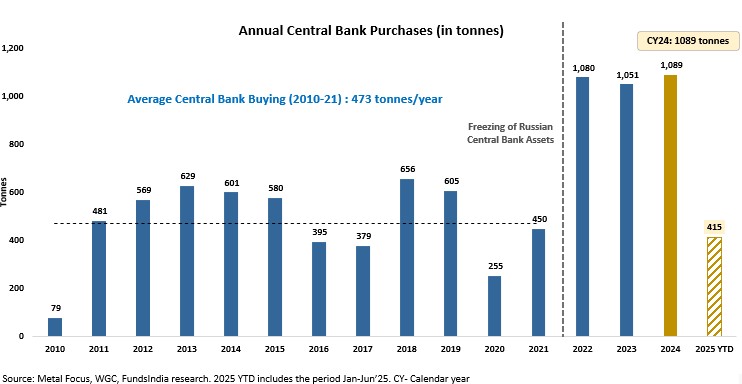
Given the above context, Emerging market central banks are likely to keep buying gold, with plans to grow their holdings from 5-10% to around 20% of total reserves.
We believe the current gold buying trend by Central Banks is just getting started as Emerging market central banks still have significant room to increase their gold reserves.
Verdict – POSITIVE for Gold.
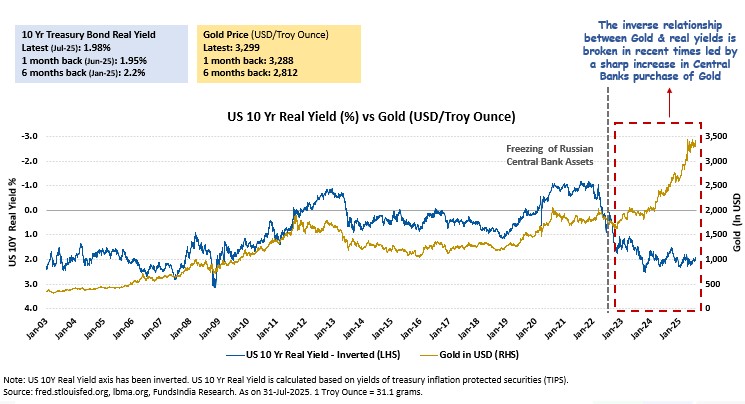
2. Y- US Real Yields
Historically, gold moves inversely with real yields:
Yields fall -> Gold rises
Yields rise -> Gold falls
This is because global investors typically choose between US 10Y bonds and gold as safe-haven inflation hedge. Increasing bond yields make gold unattractive and vice versa.
However, this relationship has broken down recently led by increased central bank demand offsetting weaker investor inflows.
Gold therefore remains strong despite high real yields (1.98% as on Jul-25).
If not for the central bank buying, the current High US real yield still remains a headwind for gold prices.
Verdict – NEGATIVE for Gold.
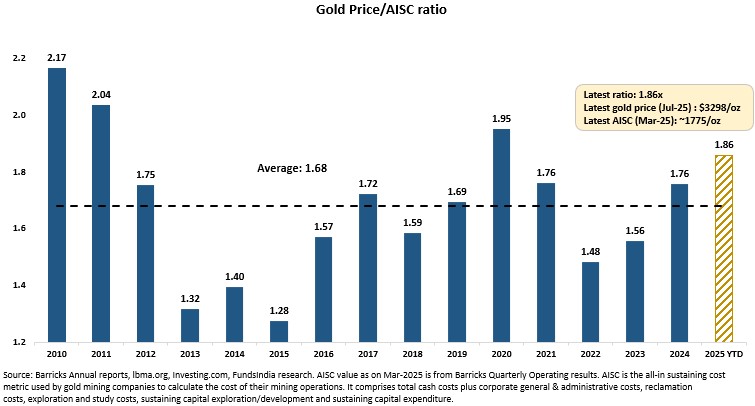
3. C – Mining Costs
To evaluate this metric, we consider the All in sustaining costs (AISC). AISC is the total cost per ounce for gold miners to sustain operations which includes:
- Direct mining costs – labor, energy & materials
- Administration, exploration, and environmental costs
- Sustaining capital – e.g., equipment upkeep and mine development.
Unlike basic cash costs, AISC gives a fuller picture of a miner’s long-term cost structure.
Comparing gold price to AISC shows how much profit cushion miners have, and whether gold is overvalued or trading near its cost.
- High Gold Price to AISC Ratio -> Strong miner margins -> Gold may be overpriced
- Low Gold Price to AISC Ratio -> Thin/no margins -> Gold may be undervalued
Currently, the ratio is at 1.85x (Jun-25), above historical averages of ~1.7x, indicating Gold is overvalued.
Verdict – NEGATIVE for Gold.
4. L – Liquidity (US M2 Money Supply)
M2 is a broad measure of money supply. It shows how much money is available in the economy for spending and saving, and includes:
- Physical currency
- Demand deposits
- Savings accounts
- Time deposits
- Money market mutual funds
We use the Gold Price to US M2 Money supply ratio to evaluate if gold is keeping up with money supply as gold has historically been a good inflation hedge.
- High Gold to US M2 Ratio -> Gold is unattractive
- Low Gold to M2 Ratio -> Gold is attractive
Currently, the ratio is High at ~2.3x -> Indicating gold is unattractive.
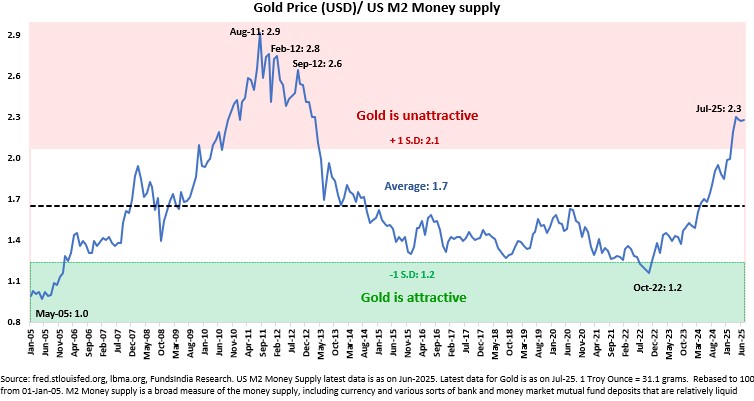
Verdict – NEGATIVE for Gold.
5. E – Equity Comparison – Gold Price to Sensex ratio
We compare gold with equities using the Gold to Sensex ratio to assess investor’s preference.
- High Gold to Equity Ratio -> Gold is unattractive vs Equities
- Low Gold to Equity Ratio -> Gold is attractive vs Equities
The current Gold to Sensex ratio is at ~1.1x, indicating Gold is neutral as compared to Equities – neither attractive nor unattractive.
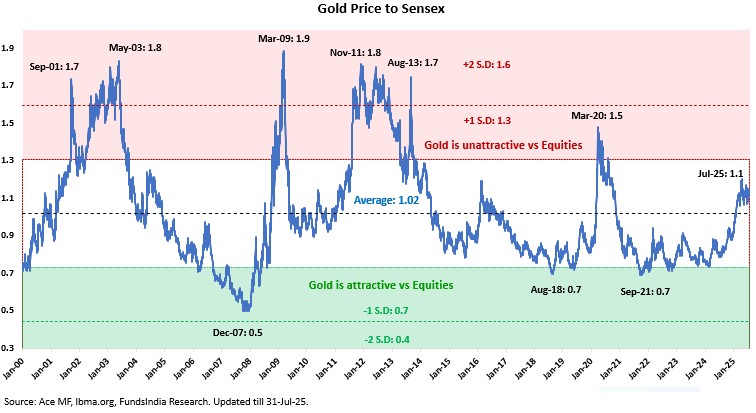
Verdict – NEUTRAL for Gold.
Putting it all together,
Our Overall view on Gold as per Gold C-Y-C-L-E Framework – NEUTRAL
Gold price at ~$3,300/ounce – (1 Positive factor + 1 Neutral factor + 3 Negative factors)
Apart from the above 5 factors, gold prices are also influenced by Geopolitical and Economic uncertainties like War, Pandemic, Market crisis etc. These events are beyond our control and are hard to predict.
What should you do now?
- Stick with your long term asset allocation to gold – Not the time to go Underweight / Overweight
- Rebalance if it deviates by ±5% from the target.
- New Lumpsum investments – Stagger over 3 months
- Eg- For a ₹1 crore portfolio with a target allocation of Equity 70% | Debt 15% | Gold 15%:
- Allocate ₹15 lakhs to gold via 3 month weekly STP
Other articles you may like
Post Views:
96